AI share of voice is one division. Take the tracked answers that name your brand, divide by the tracked answers naming anyone in your competitor set, then multiply by 100.
The arithmetic is the easy part. What moves the number is the denominator you pick, the sample you run it on, and how you handle engines that don’t carry equal traffic.
Quick answer: AI share of voice is the percentage of tracked AI answers naming your brand, out of all tracked answers naming any brand in your competitor set. Count answers for presence share and mentions for mention share, and never mix the two in one report. Strip branded prompts before you divide. Weight each engine by its real traffic, and benchmark against your share of market rather than a category average.
Run both denominators on the same week of data and they come apart. In the illustrative example below, a brand scores 23.3% on presence and 8.5% on mentions. Neither figure is wrong. They answer different questions, and a report that swaps between them is telling two stories at once.
What AI share of voice actually measures
AI share of voice measures presence in a conversation you don’t control. It counts how many AI answers name your brand, against how many name any brand in the set. One fixed prompt set, one fixed window. Four metrics sit next to each other here, and each one answers a question the others cannot.
| Metric | What it counts | What it misses |
|---|---|---|
| AI share of voice | The share of tracked answers naming your brand, out of answers naming any brand in your set | Where in the answer you land, and whether your own pages were the source |
| Mention rank (average position) | How early your brand appears inside an answer, against competitors | How often you appear at all |
| Citation share | The share of cited source links pointing at your domains rather than competitors’ | Brand mentions that carry no link back to you |
| Prompt fan-out set | The real queries an engine runs before it answers, which decides who enters the comparison | Nothing about your performance. It defines the arena |
Citation share and mention share come apart regularly, because being named and being used as a source are separate events. (How citations concentrate by source type is a story about which domains engines trust.)
But every one of those metrics rests on a decision nobody makes for you: which brands count as the set.
That decision is bigger than it looks. When we extract every brand named across a tracked project’s answers, the count runs from 230 to 1,549 (our own tracked projects, read off live dashboards in May and June 2026). Divide by all of them and your share of voice is a rounding error.
Tag the six or eight brands you actually lose deals to. Now the number describes your market.
Your competitor set is a judgment call, not a data export.
The formula, and a worked example
There are two formulas, because there are two defensible denominators.
Answers naming you ÷ Answers naming anyone in the set × 100 = Presence share
Your mentions ÷ All set mentions × 100 = Mention share
Presence share answers how often you are in the conversation. Mention share answers how much of it is yours. Pick one for the headline. But report the other beside it.
Five steps produce both numbers.
- Fix the prompt set. Twenty to thirty unbranded, buyer-intent prompts, written the way a buyer types them. Freeze the set for the reporting period.
- Strip the branded prompts. A prompt naming your brand returns close to 100% visibility by construction. Leaving it in inflates the average without any real gain. (In our experience, roughly nine in ten businesses score zero once the branded prompts come out. That is the number worth fixing.)
- Tag the competitor set. Six to ten brands you genuinely compete with, chosen before you look at the results.
- Capture on a schedule. Same prompts, same engines, same region, same time of day. (On-demand checks produce anecdotes.)
- Count, then divide. Count at both levels (answers and mentions) so you can report either without recapturing anything.
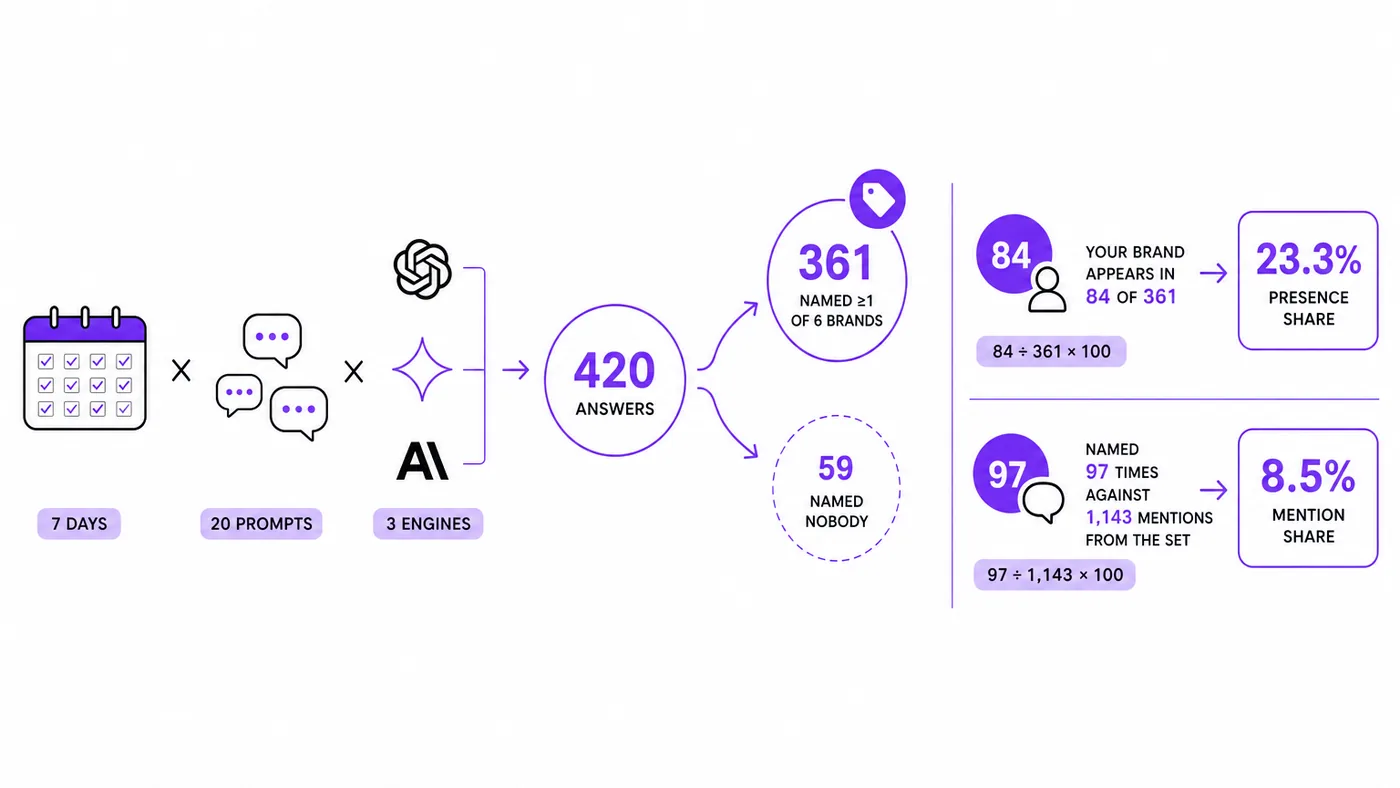
Twenty unbranded prompts across three engines, captured daily for seven days, give 420 answers in one illustrative week. Of those, 361 name at least one of the six tagged brands. (The other 59 name nobody, and they leave the denominator.) Your brand appears in 84 of the 361, and is named 97 times against 1,143 mentions from the set.
84 ÷ 361 × 100 = 23.3% presence share
97 ÷ 1,143 × 100 = 8.5% mention share
Present in a quarter of the answers, holding under a tenth of the mentions. That pattern usually means competitors are being listed in clusters while you are the single name appended at the end. Read it as a formatting problem in the source material before an absence problem.
Every count above needs five fields kept per answer: the answer text, the cited source list, the engine, the prompt, and the capture date with its region. Drop one and you can still compute a number. You can’t segment it. Set up the competitor set you are measuring against before the first capture, because retagging mid-window resets the denominator.
Weight the engines, don’t average them
Averaging your engine scores prices every engine the same. The market does not.
Worldwide web-visit share across generative AI platforms through late May 2026 ran to roughly 53% for ChatGPT, around 27–28% for Gemini and close to 9% for Claude (Similarweb, published July 2026). Renormalize those across the engines you actually track. That gives you usable weights.
| Engine | Share of visits | Weight across these three |
|---|---|---|
| ChatGPT | roughly 53% | 0.592 |
| Gemini | around 27–28% | 0.307 |
| Claude | close to 9% | 0.101 |
(Engine share of voice × engine weight), summed = Weighted share of voice
Say presence share comes back at 17% on ChatGPT, 29% on Gemini and 34% on Claude. The flat average is 26.7%. The weighted figure is 22.4%.
That 4.3-point gap comes from the smallest engine carrying the highest score. But the weighted version is the one that survives a client asking where the buyers are.
One caveat carries real weight. Web-visit share is a proxy for reach, not a measure of answer volume in your category. Substitute your own engine mix as soon as your referral data supports it.
If you have run share of voice for paid search, social and display, that channel split does not carry over. In AI search the engine is the channel. ChatGPT, Gemini, Perplexity and Google’s AI Overviews are separate surfaces with separate source mixes, so the engine is the unit you segment by. Benchmark each engine against itself, because the same percentage on the smallest engine and on the largest are not the same result.
But report the per-engine row underneath either way, because the engines don’t cite the same kinds of sources. In our citation data for one tracked project (June 2026), Google’s citations led with YouTube. ChatGPT cited no video at all. Perplexity surfaced Reddit (about 2.4% of cited domains across 1,904 cited URLs).
A blended score hides which of those you’re losing.
Setting a benchmark that means something
A share-of-voice number means little against a category average. It means something against your share of market. That comparison has a name borrowed from paid media: excess share of voice, or ESOV.
Share of voice − Share of market = Excess share of voice
Les Binet and Peter Field’s work associates roughly 0.5 percentage points of market-share growth with every 10 points of positive ESOV (Semetis). But treat it as a planning guideline, not a guarantee. Returns vary with brand size, category and campaign quality. The model was built on paid advertising share, so carrying it over to earned AI mentions is an analogy rather than a measured result.
Take the 8.5% mention share above. Hold 4% of that category’s customers and you’re running +4.5 points of ESOV, which points at slow share gain. Hold 15% and you’re winning in the market while losing the argument inside AI answers. That gap is your brief for the quarter.
By topic, not one number for the brand
A single brand-level percentage averages away the only thing you can act on. In our tracking of one category (May 2026), a brand scored 2.9% visibility on a general topic and 11% on an enterprise topic. Same brand, same mention data, different prompt intent. A rival with more total mentions scored lower on the enterprise topic, because third-party sources call it a cheap small-business tool and call the first enterprise-grade.
Set one benchmark per topic segment. Report them side by side.
By region, and by campaign only loosely
Regional comparison has one rule. Identical prompt set, or the numbers aren’t comparable.
Rerun the same prompts from each target region’s locale (same wording, same engines). Change nothing else. A US figure from 20 prompts and a German figure from 14 translated ones are two unrelated numbers wearing the same label.
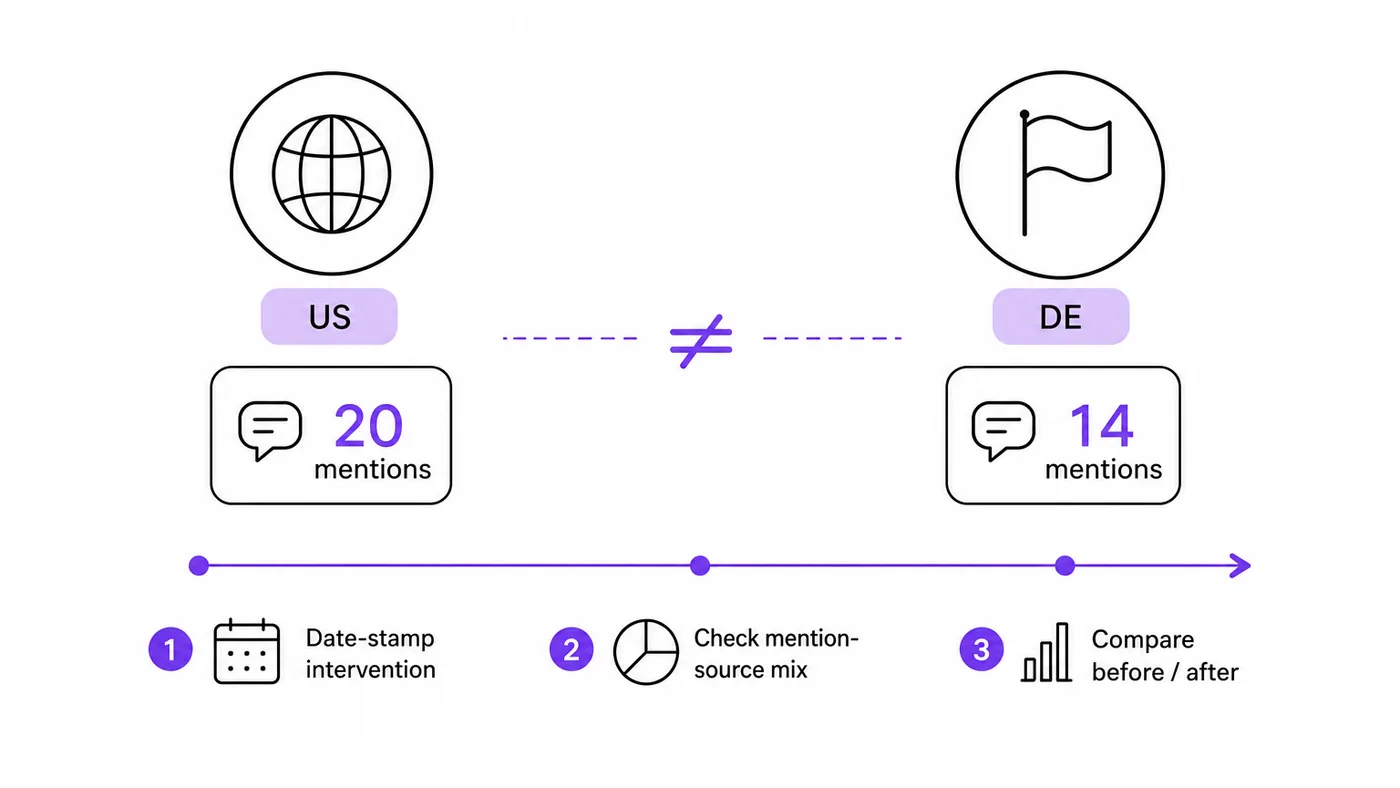
Can you attribute share of voice to a campaign the way you attribute paid impressions? No. There’s no bid, and no deterministic path from a placement to a mention. What you can do is date-stamp every intervention (a digital PR push, a new comparison page) and read the mention-source mix before and after.
Time-aligned, not attributed.
Tracking share of voice over time
Capture daily and read weekly. Engines re-roll their answers, so a single day’s capture is a coin flip rather than a trend.
Sample size decides how much movement you’re allowed to believe. At 361 answers in the window, one extra answer moves presence share by 0.28 points. At 100 answers it moves it by a full point. Below 100 answers per window you’re reading sampling noise and calling it performance.
But where you collect the answers changes them too. We query the public ChatGPT, Perplexity and Gemini interfaces daily, logged out, with no account, history or memory. Deliberately not through the API, because replies and cited sources diverge between the two.
A number built from API responses measures something real. It just isn’t measuring what your buyers see.
In practice, that means the tracking setup has to hold:
- Raw answer text, retained. Recounting against a revised competitor set is impossible without it.
- Per-engine and per-prompt breakdown. The blended number hides where the work is.
- A competitor set you control. Tagging sets the denominator, so it has to be yours to edit.
- Region and locale control. Otherwise regional comparison is guesswork wearing a flag.
- Export. Every number above should be reproducible in a spreadsheet by someone who doubts you.
Monthly is the right reporting rhythm for anyone not watching the dashboard daily. But resist reporting weekly movement as performance, because at realistic sample sizes the week-to-week swing is sampling noise.
Building a share-of-voice dashboard
Four panels cover the questions anyone will ask about the number.
- Headline weighted share of voice for the current window, with the denominator named in the subtitle. “84 of 361 answers, six-brand set” belongs on the tile, where the reader sees it.
- Twelve-week trend line, weighted, carrying a vertical marker for every intervention you date-stamped. The markers turn the line into an argument instead of a squiggle.
- Competitor table: brand, presence share, mention share, average position, and the delta against the previous window. Sort by presence share.
- Citation share by engine: your domains against competitor domains among cited sources, split per engine. That panel tells you which format to go build next.
One rule holds the whole thing together. Every panel states its window, its engine set and its prompt count. A panel that doesn’t is a panel nobody can defend in a review. The analytics plumbing behind these panels is the same export you are already pulling.
Would you rather not maintain the arithmetic by hand? You can track AI share of voice automatically: we track Share of Voice daily across ChatGPT, Perplexity and Gemini, alongside Visibility Score and Average Position. And if what you want is a shortlist of platforms rather than the method, compare GEO and AEO tracking tools instead.
Frequently asked questions
What is a good AI share of voice benchmark?
There is no cross-category benchmark. That is why the ESOV comparison above uses your own market share. As a rough absolute target: in one category we measured over May and June 2026, brands needed roughly 100–250 brand mentions inside AI citations to hold a top-10 position, and roughly 250–600 for the top three to five. Those thresholds moved over the period (one category, one window).
Is this the same as paid share of voice?
No. Paid share of voice is impression share you buy, and a higher bid moves it this afternoon. AI share of voice is earned: it comes out of how engines weigh your brand’s credibility and how many third-party sources name you. There is no same-day lever.
Can you compare two different prompt sets?
No. Two prompt sets are two different denominators, so the percentages are not on the same scale. Add prompts mid-quarter and you have reset the baseline, even if the brand did nothing. Keep the set frozen for the reporting period, and version it when you change it.


.png)


